Thursday 31 January 2013


Rods and Cones
Rods and cones have different functions in vision, and the relative numbers of these two photoreceptors in the retina are partly correlated with whether an animal is most active during the day or at night.
Rods are more sensitive to light but do not distinguish colors; they enable us to see at night, but only in black and white. Because it takes more light to stimulate cones, these receptors contribute very little to night vision. Cones can distinguish colors in daylight. Color vision is found in all vertebrate classes, though not in all species. Most fishes, amphibians, reptiles, and birds have strong color vision, but humans and other primates are among the minority of mammals with this ability.
Owl Night Vision
The Tawny Owl can locate prey several metres away by the light of just one candle about 1700 feet away! Its retina has about 56,000 rods per mm2More on owl vision...

Most mammals are nocturnal, and a maximum number of rods in the retina is an adaptation that gives these animals keen night vision. Cats, usually most active at night, have limited color vision and probably see a pastel world during the day. In the human eye, rods are found in greatest density at the peripheral regions of the retina and are completely absent from the fovea, the center of the visual field (see FIGURE 49.9).
Structure of the vertebrate eye. In this longitudinal section of the eye, the jellylike vitreous humor is illustrated only in the lower half of the eyeball. The mucous membrane, or conjunctiva, surrounding the sclera (the white of the eye) is not shown. Campbell Fig 49-9.
You cannot see a dim star at night by looking at it directly; if you view it at an angle, however, focusing the starlight onto the regions of the retinas most populated by rods, you will be able to see the star. You achieve your sharpest daylight vision by looking straight at the object of interest because cones are most dense at the fovea, where there are about 150,000 color receptors per mm2. Some birds have more than a million cones per mm2, which enables such species as hawks to spot mice and other small prey from high in the sky. In the retina of the eye, as in all biological structures, variations represent evolutionary adaptations.
The effect of light on synapses between rod cells and bipolar cells. (a) In the dark, rhodopsin is inactive, and the rod cell membrane is highly permeable to sodium and thus depolarized. In this state, the rod cell releases glutamate and regulates the "firing" of two different classes of bipolar cells, which have opposite responses to glutamate. (b) In contrast, when light activates rhodopsin, the rod cell membrane becomes less permeable to sodium, and its membrane potential changes (it develops a receptor potential, a hyperpolarization in this case). The synaptic terminals of the rod cell then slow their release of glutamate, enhancing the activity of one class of bipolar cells and suppressing the activity of the other type. Campbell Fig 49-14.  
Photoreceptors in the vertebrate retina. (a) Photoreceptors called rod cells (rods) are very sensitive to light and function in black-and-white vision at night; cone cells (cones) account for color vision during the day. Both rods and cones are modified neurons. Visual pigments are embedded in folded membranes comprising a stack of discs in the outer segment of each rod and cone. (b) Rhodopsin, the visual pigment in the disc membrane of rods, consists of the light-absorbing molecule retinal bonded to a specific type of membrane protein, an opsin. The opsin has seven regions of alpha helix that span the disc membrane. Campbell Fig 49-11.  
Rods and cones. The retina is a thin tissue layer on the inner eye responsible for sight. Light strikes from the top. At top are nerve fibers which combine to form the optic nerve to the brain. Nerve fibers have round cell bodies with branching dendrites. Rods (green) are long nerve cells which respond to dim light, enabling images to be detected. Cones (pink) are shorter cone-like cells which detect color. Rods and cones pass visual signals through the optic nerve to the brain. Pigment cells block light from passing further.

Role of the Rods and Cones

The rods and cones (strictly speaking, those portions that are outside of the outer limiting "membrane" of the retina) are the actual sites of transduction of light energy into neuronal signals. They are, in essence, exceptionally specialized bipolar neurons, which have developed some structural features to carry out this task.
The rod is the "model" transducer, and will be given most attention here. The mechanism by which light energy is converted to neuronal signals is exactly the same in both rods and cones; the difference between the two types of receptor are in the visual pigments involved.
Rods respond to very low levels of light at all wavelengths of the visible spectrum by generating a signal. Consequently they are of greatest importance under conditions in which lighting is dim and discriminating colors is not a primary requirement. However, the cones are wavelength specific to a degree, and are therefore responsible for color vision. Cones are also much less sensitive than rods, and require higher levels of light to generate signals. Thus they work best in daytime conditions.

Structure of the Rods and Cone

Each is a fairly large cell. The rods and cones are "polarized" in the sense that they have distinctly different architecture and function at each end. The outermost portion of these cells is a highly modified cilium, greatly expanded in size, and consisting of a stack of numerous light-sensitive folds of membrane material. These stacked lamellae are the actual sight of transduction. The names "rod" and "cone" reflect the general shape each type of light receptor takes, and in good preparations for the light microscope, the shapes are easily visible.
What is shown at left is actually only part of the cells, the outer segment of each type. This image, which is based on detailed reconstructions from transmission electron micrographs, clearly shows the origins of the names "rod" and "cone". The outer segments drawn here, are connected by a narrow "waist" or constriction to the inner segment of each cell type. Both outer and inner segments are physically isolated from the cell bodies of the rod and cone cells by the outer limiting "membrane" and the actual cell body is located in the outer nuclear layer.


The image at the left, a transmission electron micrograph, shows the "waist" between the inner and outer rod segments. The light sensitive lamellae of the outer segments are obvious, as is the narrow constriction. Note that in the constriction itself, there is an actual modified cilium, complete with basal body and ciliary rootlets. This remarkable structure is proof that the outer segment is really a highly modified cilium, and that the membranous lamellae are extensive ramifications of its plasma membrane. the modification of cilia to perform sensory functions is found in other locations in mammals: the olfactory cells of the nose are another example of a highly-specialized neuron with greatly-modified cilia devoted to sense perception rather than movement of fluid.

Vision is a vitally important sense in all vertebrates, but some groups have better vision than others. Color vision is best in birds and primates. Humans, whose senses of smell and hearing are less acute than those of most quadrupeds, depend primarily on vision for orientation to the world around them. Human vision is among the best in the animal kingdom, and the ability of humans to detect subtle variations in colors is well documented. This makes some evolutionary sense: in both groups the sense of smell is rather poor (many birds are believed to have no sense of smell at all) and the necessity to identify food sources and potential mates is crucial to survival. The bright colors of birds serve as a visual means of species recognition to prevent unproductive cross-specific matings. In primates, vision is used to identify edible plants, and binocular vision confers the depth perception needed for arboreal life.
There is a widely-held belief that domestic animals are "color-blind," but this has yet to be definitively proven. Such data can only be derived from indirect experimentation using behavioral studies, but many such studies are contradictory and inconclusive. It is certainly true that in some animals chemorecption and hearing are more important sensory modalities than vision, but it is has also been demonstrated that the color-sensitive cones are present in virtually all animals to some degree. The anatomic structures for color vision are present. Whether the signals these cells generate are interpreted as "color" in the same sense that primates do is a matter of debate and certainly occurs at the level of the central nervous system, not in the eye itself.

A summary of rod and cone TCSFs and two-pulse summation studies
Study Receptor
type
Method Adaptation
level
a
Spatial extent Surround Retinal
locus
Pulse duration
(ms)
Hess and Nordby (1986) Rod TCSF 0.003–130 ST 10 · 15 (0.3 cpd
grating)
N/A 4 –5
Nygaard and Frumkes (1985) Rod TCSF 0.025–0.4 ST 2 No 7
Smith (1973) Rod TCSF 0.005–50 ST 7 (0.3 cpd grating) N/A 7
van den Berg and Spekreijse
(1977)
Rod TCSF 0.13 ST 5 No 10
de Lange (1958) Cone TCSF 4.3–430 PT 2 Yes Fovea
Keesey (1970) Cone TCSF 26–260 PT 1 Yes Fovea
Kelly (1959) Cone TCSF 1000 PT 2 Yes Fovea
Roufs (1972) Cone TCSF 2–525 PT 1 No Fovea
Swanson et al. (1987) Cone TCSF 0.9–900 PT 2 No Fovea
van der Gon/van der Tweel
(1961)
Cone TCSF 2–200 PT 0.37 No Fovea
van Nes et al. (1967) Cone TCSF 0.85–850 PT 0.64 cpd grating N/A Fovea
Burr and Morrone (1993) Cone 2 Pulse 163 PT 6.25 (1 cpd grating) N/A Fovea 8
Herrick (1972) Cone 2 Pulse 5.0–210 PT 1.1 No Fovea 5
Ikeda (1965) Cone 2 Pulse 61.2 & 328 PT 0.5 Yes Fovea 12.5
Meijer et al. (1978) Cone 2 Pulse 120 PT 1.6 No 3.5 10
Roufs (1973) Cone 2 Pulse 1–120 PT 1 No Fovea 2–3
Shinomori and Werner (2003) Cone 2 Pulse 49 PT 2.26 (Gaussian
patch)
N/A Fovea 1.2
Uchikawa and Yoshizawa
(1993)
Cone 2 Pulse 10 PT 1.5 No Fovea 10
Uetsuki and Ikeda (1970) Cone 2 Pulse 1–300 PT 0.5 Yes Fovea 10

Is it true that colour blindness only affects boys?


False.
 
It’s estimated that up to eight per cent of boys have some degree of colour blindness (also known as colour vision deficiency or CVD), whereas less than one per cent of girls do. That’s about one in 12 boys, and around one in 200 girls.
 
What causes colour blindness?
 
Colour blindness has different causes. For most people with the condition, it’s genetically inherited from their mothers on the 23rd chromosome. That’s the one that determines gender. For a boy to be red-green colour blind, it’s just a matter of a faulty colour-blindness gene on his X chromosome. For girls, that faulty gene must be present on both their X chromosomes – hence the greater prevalence of red-green colour blindness among males. Note however, that blue colour blindness affects boys and girls equally, since it is carried on a non-sex chromosome.
 
Cone cells in the retina of the eye are divided into three groups – red, blue, and green – according to their sensitivity to certain colours or colour combinations. If these cones don’t function correctly, then the brain gets inaccurate messages about colour. For example, that green traffic light may appear to be tan-coloured or grey.
 
What do colour-blind people see?
 
Most colour-blind people can see things as clearly as other people do, but they can’t fully see red, green or blue light. In some uncommon cases, colour-blind people cannot see any colour at all.
 
The most common form of colour blindness is red-green, where any colour with any element of red or green in it will not be seen completely. That means it goes beyond just red and green. Blues and purples may be indistinguishable to the red-green colour-blind person, because the red component in the purple will not be visible.
 
People can also become colour blind as a result of diabetes, multiple sclerosis and other diseases. They can also acquire the condition over time as a result of aging or the use of certain drugs such as antibiotics and high-blood pressure medications.
 
Colour blindness can range from mild and moderate to severe. Some colour-blind people may not even know about their condition. If you’re concerned about this aspect of your children’s vision, you can consult your family eye doctor or their school nurse about tests for colour blindness.

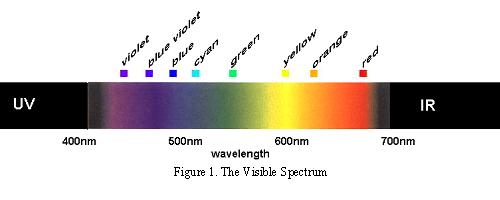
Colour is a perceptual interaction arising from our ability to discriminate between different wavelengths of light from within a narrow band of electromagnetic radiation. Light itself has no colour. The colour of a specific wavelength can change according to context. For example, in the above picture, despite having the same spectral reflectance, the ‘X’ appears to be different when set against the two different backgrounds (Albers J. 1975).
Colour is used to allow us to interact with our environment. Some scholars suggest that being able to choose ripe fruit and edible berries may have influenced the selection of colour-categorising vertebrates. Although the visual system is the most scientifically studied system of the brain, it is still unclear where our ability to see colours comes from, what entities colour sensations are (Backhaus and Menzel 1992, 28), and the processes involved in the conscious perception of colour (Valberg 2001).
In his book, The Symbolic Species, Terrence Deacon talks about the co-evolution of language and the brain. He makes reference to the exciting cross-cultural linguistic research of Berlin and Kay. Berlin and Kay showed that the basic colour mechanisms were consistent across different cultural groups and were based on the underlying psychophysical similarities of the human brain.
“In summary, the universality of colour term reference is an expression of shared neurological biases, but—and this is a crucial point—the translation of this biological constraint into a social universal is brought about through the action of nongenetic evolutionary forces.”
(Deacon, (1997), The Symbolic Species, p119-120)
Language requires the coordination of perceptually grounded categories with a socially-negotiated set of shared linguistic conventions to express them; i.e. language is based on shared groups of meanings that arise from our perceptual interaction with the external world and the way in which we convey that relationship to other human beings. Deacon’s opinion is that neurological predispositions and socio-ecological constraints sponsored the development and evolution of language, and that the subsequent feedback system gave rise to a complex coevolution of the two. Founded neurological determinism within evolutionary and socio-ecological boundaries drives the core of his argument.
There is one fundamental aspect of the conscious experience Deacon doesn’t present. The way in which humans interact with our environment is largely determined by how we ‘perceive’ that environment. What we perceive though, is not always what the rods and cones of our retina detect.
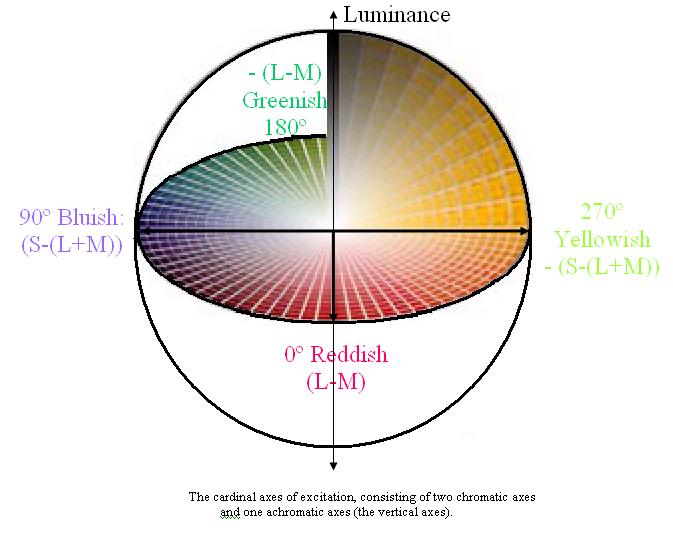
The colours to which we are perceptually attuned do not correlate with the wavelengths of light that selectively, but not exclusively, stimulate our rods and cones and subsequently the retinal ganglion cells. There are two chromatically opponent cardinal mechanisms that correspond to the properties of the receptors located in the retina and the Lateral Geniculate Nucleus. These wavelengths roughly equate to reddish, greenish, yellowish and bluish as shown in the following picture:
Whilst the cardinal axes are defined on the basis of chromatic contrast detection (Krauskopf, Williams, Heeley 1982), a second set of axes are used to describe colour identification (Boynton 1965). These are the unique hues (Hurvich, Jameson 1957). The unique hue axes differ from the cardinal axes in that they are defined based upon the perception of colour. The identification of the perceptual colour axes, i.e. the unique hues, is based on both experimental studies (Hurvich & Jameson, 1956; Boynton et al., 1964) and cross-cultural linguistic evidence (e.g. Berlin & Kay 1969; Heider & Olivier, 1972). The four unique hue axes do not lie along the poles of the four cardinal axes (Webster, Miyahara, Malkoc & Raker 2000), which demonstrates the discrepancy between the reception and perception of colour.
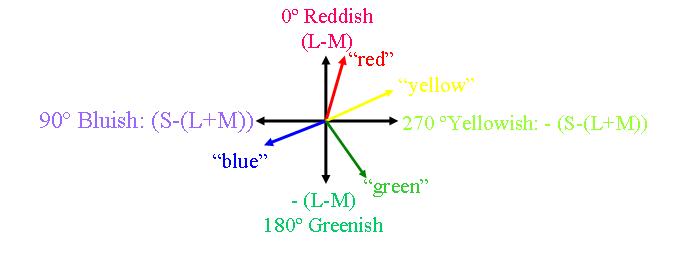
The unique hues are red, yellow, green and blue and their relations of hue similarity have an opponent structure. They are colours that cannot be made up of a combination of other colours. However, other colours can readily be described as mixtures of the unique hues. For example, the binary hues are perceptual mixtures of the unique hues, they include purple (blue and red), orange (red and yellow), olive (yellow and green) and turquoise (green and blue). It is important to make clear that hue mechanisms do not correspond to the spectrally opponent LGN cells because these cells respond not only to chromatic variations but also to achromatic stimuli and to spatial patterns.
Allow me to describe this discrepancy another way:
Colour is in some ways a result of ratios of activation. The experience of colour is dependent on the existence of two or more cones with different spectral sensitivities. In humans there are normally three different types of cone-cell used to sample the continuous spectrum of light.  Each of the cones absorbs a range of wavelengths but preferentially absorbs photons at specific wavelengths.
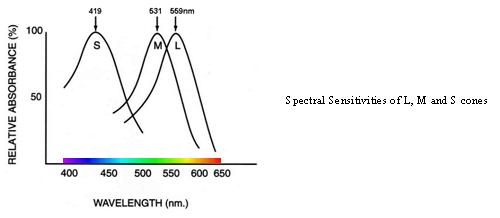
The L-cones are most likely to absorb wavelengths at around 559nm, the M-cones at around 531nm and the S-cones at around 419nm (Dartnall et al. 1983). Each cone type contains a different photopigment and each photopigment has a distinctive wavelength where it is most likely to react. At the wavelengths outlined above, the probability that a photon is absorbed increases and a greater proportion of photopigment is bleached. Cone sensitivity at any wavelength is dependent on the light intensity, and absorption of a photon always results in the same electrical response regardless of the stimulus wavelength. In essence, the wavelength is lost at the photoreceptor i.e. specific information about wavelength is converted to much less precise information coded by the photoreceptors.
Wavelengths are turned into a specific pattern of signals and colour appearance is influenced by the ratios of cone excitations and by the overall levels of cone excitation caused by the prevailing illumination. There is significant overlap in the response curve to spectral sensitivities of the three cone types resulting in a relatively high correlation and redundancy of signals (Lennie, 2000). This redundancy is filtered later on in the system and higher order chromatic mechanisms are required to account for the unique hues (red, green, blue and yellow) of colour perception.
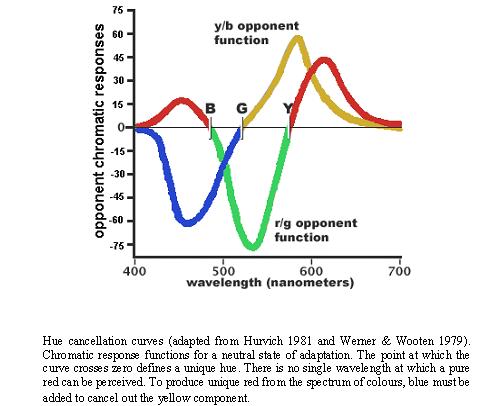
When average subjects are asked to mix four specific wavelengths of light (corresponding to the cardinal colours), using a hue cancellation procedure, to exactly match (or cancel to gray) the color of any single wavelength, their average mixtures follow the hue cancellation curves shown above (Werner & Wooten 1979). It is important to note that the mixing of opponent curves is neither as symmetrical nor evenly spaced across the spectrum as the cardinal colour axes would predict. This discrepancy suggests that the subjective sense of uniqueness or purity of hues for highly specified wavelengths is not determined by the retinal or LGN opponent-process cells. The LGN opponent cells are responsive to chartreuse/violet and teal/cherry i.e. greenish-yellow/deep-purple and greenish-blue/bright-red (Abramov & Gordon 1994:468).
Psychophysicists have known for a long time about the many discrepancies between accepted opponent-colours theory and the empirical phenomena (Judd 1951). An analogue of this discrepancy is the apparent mismatch that exists between the Cardinal axes (Krauskopf, Williams, Heeley 1982) and the Unique Hue axes (Hurvich, Jameson 1957). Whilst the cardinal space can be directly related to cone (three-colour) excitation, the Unique Hue space cannot. Thus, the chromatic cardinal mechanisms cannot be considered as correlates of the perceptual unique hues (Valberg 2001).
If you’ve followed me up to here, then you have done a great job! If you haven’t, then perhaps I need your help to find out how I can express myself better!!!
So, after this discussion about how the discrepancy between wavelength reception and colour perception, we come to the question, are colours in the brain?
To answer this question, I will refer to a phenomenon in the environment, metamers, and a phenomenon found in some humans, synaesthesia.
Metamers are objects with distinct spectral reflectance properties that nonetheless appear the same. Their apparent similarity occurs because the colour of an object depends on how wavelengths reflected from that object activate each of three types of photoreceptor in the eye (Rosenthal 2001). The brain computes visual colours by analysing the relative excitations of these photoreceptors. Thus, colours result not from specific wavelength, but from ratios of activation. Hence, humans see many combinations of wavelength as the same colour, because many combinations will produce the same ratio of activation of the three types of cone cell. So, in some philosophical circles, colour could be seen as something in your brain.
It is the phenomenon of synaesthesia in colour-blind people which is perhaps most intriguing for our question. Ramachandran & Hubbard have described a case of a colour-blind man with synaesthesia. Being colour blind, there are certain colours he has never seen. However, his synaesthesia sometimes elicits extrasensory colours, or “Martian Colours” as this synaesthete calls them. Even in regular synaesthetes, there are reports of colours being elicited through their synaesthesia that confer unusual tints to the colours they see in the natural world. Could this finding suggest that colour is in the brain?
I have to say that, for the moment, I shall sit in the interactionist camp on this one!!!

The Retinaeye

rcThe retina is the back part of the eye that contains the cells that respond to light. These specialized cells are called photoreceptors. There are 2 types of photoreceptors in the retina: rods and cones.
The rods are most sensitive to light and dark changes, shape and movement and contain only one type of light-sensitive pigment. Rods are not good for color vision. In a dim room, however, we use mainly our rods, but we are "color blind." Rods are more numerous than cones in the periphery of the retina. Next time you want to see a dim star at night, try to look at it with your peripheral vision and use your ROD VISION to see the dim star. There are about 120 million rods in the human retina.
cThe cones are not as sensitive to light as the rods. However, cones are most sensitive to one of three different colors (green, red or blue). Signals from the cones are sent to the brain which then translates these messages into the perception of color. Cones, however, work only in bright light. That's why you cannot see color very well in dark places. So, the cones are used for color vision and are better suited for detecting fine details. There are about 6 million cones in the human retina.peopleSome people cannot tell some colors from others - these people are "color blind." Someone who is color blind does not have a particular type of cone in the retina or one type of cone may be weak. In the general population, about 8% of all males are color blind and about 0.5% of all females are color blind.
foveablindsThe fovea, shown here on the left, is the central region of the retina that provides for the most clear vision. In the fovea, there are NO rods...only cones. The cones are also packed closer together here in the fovea than in the rest of the retina. Also, blood vessels and nerve fibers go around the fovea so light has a direct path to the photoreceptors.
2doHere is an easy way to demonstrate the sensitivity of your foveal vision. Stare at the "g" in the word "light" in middle of the following sentence:
"Your vision is best when light falls on the fovea."
The "g" in "light" will be clear, but words and letters on either side of the "g" will not be clear.
One part of the retina does NOT contain any photoreceptors. This is our "blind spot". Therefore any image that falls on this region will NOT be seen. It is in this region that the optic nerves come together and exit the eye on their way to the brain.
To find your blind spot, look at the image below or draw it on a piece of paper:
o                                  +
Close your left eye.
Hold the image (or place your head from the computer monitor) about 20 inches away. With your right eye, look at the dot. Slowly bring the image (or move your head) closer while looking at the dot. At a certain distance, the + will disappear from sight...this is when the + falls on the blind spot of your retina. Reverse the process. Close your right eye and look at the + with your left eye. Move the image slowly closer to you and the dot should disappear.
Here is another image that will help you find your blind spot.
tester
For this image, close your right eye. With your left eye, look at the red circle. Slowly move your head closer to the image. At a certain distance, the blue line will not look broken!!
The Eye has been likened to a camera, in that it has a focussing lens and a light-sensitive medium (the retina) in the focal plane of that lens. But that is about the limit of the similarity. The Eye is really an extension of the brain, and it is the primary source of information for the brain. A rough estimate of the information capacity of the eye-brain link (the optic nerve) is about 1 million bits/second.
Diagram of the Eye
Let's look first at its optical properties. Most of the focussing of incoming light is done by the Cornea, i.e. refraction at the air-cornea interface.
Light path in Eye
The Lens acts as a fine adjustment of the focus. The average refractive index of the Eye is about 1.33, the same as water, because the “humours” are mostly water. The Lens is a flexible structure, like a thick jelly, and has a number of layers in it, so that its refractive index increases towards the centre; this helps to reduce internal reflections, like the “bloom” on a camera lens. It is normally kept under tension by the fibres of the Ciliary Body, but there is a ring of muscle round the lens which acts to take up the tension in these fibres, and allows the lens to relax into a more spherical shape. This in turn increases its optical power, making the eye focus on closer objects.

The Optical Power (F) of a lens is measured in dioptres. There is a simple relationship:
F = 1/f = 1/p + 1/q
Focussing by the Lens
f is called the Focal Length and is equal to the image distance q when the object is at infinity (p = ∞).The ratio q/p is also equal to the object magnification.

The advantage of using F is that if you put two lenses together, the resulting power is simply F1+F2, but only if they are close together; if they are separated, the formula is more complicated. So the cornea and lens powers can be added, and we can regard the variable power of the lens as a range of F, known as the Accommodation of the eye.

The effective power of the eye is about 50 dioptres, i.e. f=20 mm. An object 10 cm long at a distance of 1 metre will give an image 2 mm long on the retina. In children, the range of accommodation is about 10 dioptres (F can vary from 50 to 60), so their eyes can focus from infinity down to 10 cm. The range gradually decreases with age as the lens becomes less flexible. Typically it is down to 5 dioptres at age 40, and less than 2 dioptres at 65. This condition is known as Presbyopia and is quite normal – most older people need reading glasses.

Focussing Defects
However, the focussing of the relaxed eye may actually be wrong. If it is too strong, the image of a distant object is formed somewhere in front of the retina. A closer object would give the correct focus:
Myopia
This condition, when D is too high, is called Myopia, or Short Sight. It can be corrected by a negative lens:
Myopia correction
The opposite condition is called Hypermetropia, or Long Sight. The relaxed eye will not even focus on infinity, and the lens muscle has to be activated to enable any focussing. The continuous need to activate this lens muscle can lead to complaints of eye strain and headaches as the first reported symptoms. Correction is done with a positive lens.

Further focussing faults can arise from Astigmatism. The curvature of the cornea is not the same in all directions; it is slightly ellipsoidal. Typical symptoms are that vertical and horizontal lines have a different focus. It is corrected by a cylindrical lens as shown below:
Astigmatic lens
Response to Light Level
The Iris is the eye's way of “stopping down”, i.e. changing its aperture or f-number. The central hole, the Pupil, normally varies in diameter from about 3 mm in bright light to 8 mm in very dim light. Now this is a range of light-gathering power of only 7 to 1, whereas the eye can cope with a brightness range of 1010 to 1. (You may not believe it, but a sunlit scene is one million times as bright as a full moonlit scene!)
So why bother with an iris?
One reason is that visual acuity and depth of focus are better with a small pupil. But the full answer isn't really known. Most of the light/dark Adaptation occurs in the Retina, which is an interesting structure.

If you look into the eye using an Opthalmoscope, you will see a generally reddish brown surface, with peripheral blood vessels running towards an off-centre dark spot, known as the Blind Spot. This is where the optic nerve converges and leaves the eye. To the centre is an area devoid of blood vessels, called the Macula Lutea, and right in the middle of this is a tiny area (about 300 Âµm diameter) where all the most detailed vision takes place, called the Fovea. Nowhere else in the body is there such a tiny yet vital piece of tissue!

The Retina covers about half of the inside of the eye. The light-sensitive cells are the rods and thecones. Oddly enough, the light has to pass through several layers of nerve cells, except in the fovea, where they are pushed to the side to improve acuity of vision. There are about 6 million cones and 120 million rods over the retina.
  • Cones are responsible for colour, daytime (photopic) vision. The peak response is around 560 nm (yellow).
     
  • Rods give monochrome, nighttime vision (scotopic). The peak response is nearer 500 nm (green-turquoise).
Rods are much more sensitive to green and blue light (by up to 1000 times). Cones are most abundant in the macula and fovea, but exist over the whole retina. There are very few rods in the fovea; they reach a peak density about 20° away from the fovea. This is why you can often see things better at night if you don't look directly at them. The blind spot is about 15° to the side of the fovea, and covers about 5°.

Dark Adaptation is accompanied by the build-up of a pigment (dye) called Rhodopsin, and takes about 30 minutes to reach full strength. Cones dark-adapt rapidly, but only to a limited extent. Rods increase their sensitivity by a factor of over 1000 within 20 minutes. Subsequent exposure to to bright light bleaches the rhodopsin (gives you a kind of "white-out" vision while it takes place). The two eyes can be dark-adapted independently.

Under optimal conditions, the eye can detect as few as 10 photons landing on the retina within 0.1 seconds. This actually requires nearer 90 photons incident on the cornea.

The ability to resolve brightness differences (contrast) drops substantially at low light levels. At typical reading light level of 100 mL (millilambert), a difference of 1% can be seen. At the levels used in unenhanced fluoroscopy, for example (about 10-6 lambert), it has to be about 20%. [The Lambert is not an SI unit, but is still frequently used. The SI unit of surface illumination is the Lux, or lumen per square metre; 1 mL is 10 lux.]

Much odder is that spatial resolution drops markedly at low light levels. In part this is due to increased pupil size, allowing lens aberrations to have more effect, but it now seems that the answer lies in the behaviour of the nerve cells immediately overlying the retina. These are much more than simple buffer amplifiers, as was once thought. They carry out some local image processing functions such as edge enhancement. At low light levels, they seem to switch over to a smoothing function, averaging the signals from groups of rods.

Cones apparently use three different pigments each having a different spectral response. This accounts for our three-colour vision. In colour-blind people, one of these pigments is missing or altered - usually the red-sensitive one.
Retinal molecule
Rhodopsin works by changing its molecular shape. Part of the molecule is called Retinal, and changes from CIS- to TRANS- configuration when light falls on it (bond 11-12 can twist). The TRANS form is more linear, and allows it to become detached from the rest of the molecule (known as OPSIN), which becomes the bleached form, and activates the rod. Cis-retinal is regenerated, and reforms the full rhodopsin molecule with a time-constant of about 7 minutes. Retinal is closely related to vitamin A (retinol), which has a -CH2OH group (alcohol) instead of the -CHO (aldehyde).
We have constructed a new adaptive optics instrument (Gray et al., 2006) equipped with adaptive optics, providing <2 micron transverse resolution and providing video-rate (27 Hz) acquisition of 512x512 fluorescence images of the retina. The FAOSLO has a confocal pinhole that improves contrast through increased optical sectioning (115 microns). Its adaptive optics system has a 904 nm laser beacon, a Shack-Hartmann wavefront sensor (WFS), and a 144 actuator Boston Micromachines MEMS deformable mirror (DM). The scanning system (VS: vertical scanner, HS: horizontal scanner) has an adjustable 0.5 - 2.89 degree field of view. Fluorescence imaging is achieved with an AR/KR tunable laser source and a photomultiplier tube (PMT) for fluorescence light detection. Infrared reflectance imaging of the retina is achieved with a 788 nm super luminescent diode source and an avalanche photodiode (APD) for light detection. The two imaging modalities have independent focus control and can be used simultaneously. For example, it is possible to image the cone mosaic in the infrared and the RPE mosaic with autofluorescence (AF) in the visible.
Figure 2 shows FAOSLO images obtained in vivo: a) Using 488 nm excitation, a 495 nm long pass dichroic and 35 nm band pass filter centered at 520 nm, the complete capillary bed surrounding the avascular zone is visible (Scale bar = 150 microns) from Gray et al (2006) b) in vivo images of ganglion cell somas, axons, and dendrites labeled with rhodamine dextran retrogradely transported from an LGN injection (Scale bar = 50 microns) from Gray et al (2008).

Imaging RPE Cells In Vivo with Autofluorescence

The FAOSLO has provided the first in vivo images of the RPE cell mosaic in the normal primate eye (Gray et al, 2006; Morgan et al, 2008; Morgan et al, in press), taking advantage of the resolution provided by adaptive optics and the AF of lipofuscin inside RPE cells. We use a 568 nm laser line for excitation because it maximizes the signal at the detector, given the additional spectral constraints imposed by the ANSI maximum permissible exposure and the lipofuscin excitation spectrum. The fluorescent emission is collected over a 40 nm bandwidth centered at 624 nm.
In a typical frame, the signal measured by the PMT corresponds to only 0.2 photons/pixel, so over a thousand frames are typically averaged to generate a single fluorescence image. Eye motion between successive frames requires image registration before averaging, but the fluorescence images are too dim to register with cross-correlation. To overcome this problem, the FAOSLO simultaneously records a high SNR movie of the photoreceptors using reflectance imaging in the near infrared and a low SNR fluorescence movie of the RPE in the visible. Since the two movies share the same retinal motion, cross-correlation of cone frames can be used to compute the eye motion correction for the dimmer RPE frames. Figure 3 shows the cone mosaic (a) and RPE cell mosaic (b) in exactly the same retinal location imaged simultaneously at 6.4 deg eccentricity. Cone density is 22,692 cells/mm2 while RPE cell density is 4,184 cells/mm2, corresponding to 5.4 cones/RPE cell. Discrete RPE cells can be seen because the cell nucleus does not contain lipofuscin and appears dark, whereas the cytoplasm surrounding the nucleus appears bright due to lipofuscin AF. Figure 3 c and d show a Voronoi analysis (Galli-Resta et al. 1999; Baraas et al., 2007) of the cone and RPE mosaics, respectively. This analysis provides information about the number of nearest neighbors surrounding each cell (color coded in the figure) that can be used to provide quantitative measures of the density and regularity of each mosaic.

Light-induced changes in RPE Autofluorescence

We acquired images of the RPE and cone mosaics at a given retinal location before and after a 15 minute exposure to an intense light delivered to a smaller, square patch of retina (0.5 deg) within the imaging field of view (2 deg). During the exposure, eye motion was monitored with the FAOSLO and the retina was manually stabilized. The ratio of the mean AF intensity inside and outside the exposure location was calculated for each pre- and post-exposure image. Each post-exposure ratio was divided by the pre-exposure ratio, which normalizes for any pre-existing local differences in AF intensity inside and outside the exposure site. We call this value the AF-ratio. A value of one means the light exposure had no effect on AF intensity, a value less than 1 indicates that the light exposure caused a reduction in AF, and a value greater than 1 would indicate that the light exposure caused an increase in AF.
Figure 4 shows a series of RPE images of the same retinal location before and at various times following exposure to 586 nm light at a retinal radiant exposure of 788 J/cm2, illustrating the sequence of light-induced changes in RPE AF that we observed. Immediately post-exposure, a decrease in AF was observed at the site of the exposure. The AF-ratio dropped from a value of 1 to 0.66 immediately post-exposure and then recovered partially to 0.76, 1.5 hours post-exposure. Throughout the AF reduction and recovery, the RPE mosaic remains intact. However, 11 days post-exposure, we observed a disruption in the RPE mosaic at the exposure site that persisted as long as 165 days post-exposure. This was observed for radiant exposures ≥ 247 J/cm2. What is especially striking is that both AF reduction and RPE disruption occur at light levels below the maximum permissible exposure (MPE) specified by the American National Standards Institute's standard for the safe use of lasers (ANSI Z136.1, 2007). These retinal changes are all the more alarming given that the MPE is designed to be 10 times below the damage threshold (ANSI Z136.1, 2007). Recently, we have also observed AF reduction and RPE disruption with 488 nm exposures below previously published damage thresholds (Ham et al, 1979; Lund et al, 2006).
Figure 5 shows the dependence of AF reduction and RPE disruption on the energy used in the light exposure over 3 log unit range.
Figure 6 shows the effects of light exposure 6 days after exposures at two different intensities, 150 µW and 55 µW, both at 568 nm light for 15 minutes. For both the 150 µW and 55 µW cases, there is a clear disruption of the RPE cell mosaic (Scale bar = 50 microns). For the 150 µW case, the reflectance image also shows damage in the photoreceptor layer, no photoreceptors are observed at the site of the exposure. However, for the 55 µW case shown here, the photoreceptor layer does not show damage. This suggests that our dual imaging method may allow us to further chart the separate effects of light exposure on these two intimately related cell mosaics.
AF reduction is photochemical in nature as evidence by our observations of reciprocity for exposure power and duration and that neither adaptive optics nor laser scanning exacerbated AF reduction and RPE disruption. The mechanism responsible for AF reduction and that for RPE disruption are integrating the total power delivered to the retina. Recent evidence with 488 nm light exposures also suggests that AF reduction involves multiple lipofuscin fluorophores.
The AF-ratio was also measured for a total of 6 exposures with 1.6 mW of 830 nm light for 15 minutes. During the 15 minute exposure the 568 nm light was turned off, but was used to acquire the pre- and post-exposure RPE images. No changes in AF were observed with near-infrared light. This result makes it possible to image human retina safely in the IR with AOSLO technology, since 1.6 mW provides more than adequate power for high resolution retinal imaging.

Retinal Imaging

Imaging the human retina has always held considerable interest in ophthalmology and vision science. In vitro histology images have revealed millions of cells in the retina. Non-invasive, in vivo imaging makes the study of healthy retinal structure and function possible. It permits early detection and diagnosis of retinal diseases such as age-related macular degeneration, diabetic retinopathy and glaucoma. Doctors use ophthalmoscopes and fundus cameras to non-invasively image the human retina in vivo. However these low magnification, wide field of view images cannot be used to detect diseases in their early stage, to detect microscopic retinal damage or to study the cellular structure of a healthy retina.
Figure 1. Adaptive optics permits nearly diffraction limited, cellular resolution imaging of the human retina in vivo
Figure 1. Adaptive optics permits nearly diffraction limited, cellular resolution imaging of the human retina in vivo [1]

Need for superresolution in retinal imaging

There are several structures in the retina that are smaller than 2 microns in size such as rods, foveal cones, fine blood capillaries, ganglion cell axons and dendrites, etc., which have been observed in vitro, but are not easily resolved in vivo in most instruments. The wavelength used for imaging and the numerical aperture of the imaging system are the two factors that limit the resolution of the system. Reduction of wavelength is not possible beyond eye-safety limits. The limiting aperture in imaging the retina is the pupil of the eye. It is not possible to dilate a patient’s pupil to greater than 6 – 8 mm diameter. Hence the spatial frequencies that are captured by the optical imaging system are limited by the size of the pupil. In order to capture the higher spatial frequency structures in the retina, it is essential to somehow effectively increase the size of this aperture. The technique of structured illumination imaging has been used in microscopy [3] to image spatial frequencies beyond the cutoff of the system. We apply this approach to a flood-illuminated adaptive optics retinal imaging system to capture those higher spatial frequencies which normally do not lie within the passband of the system to obtain superresolved images.

Structured Illumination for superresolution

This is a method of resolving spatial frequencies of an object that are normally outside the passband of an imaging system. Usually, the object being imaged is illuminated by a flat, uniform illumination. In this technique, instead, the object is illuminated by a sinusoidally patterned illumination. Effectively, sinusoidal illumination multiplies with the spatial frequencies of the object giving sum and difference frequencies. If the difference spatial frequencies are lower than the cutoff of the imaging system, they can be captured as aliased, moiré patterns in the image. If we have prior knowledge of the sinusoidal illumination spatial frequency then the unknown object spatial frequencies can be calculated from such images. Thus, sinusoidally patterned illumination can be used to image spatial frequencies beyond the diffraction cutoff of an imaging system.
Figure 2. Concept of structured illumination for superresolution
The effective object is the product of the object and the sinusoidal illumination pattern (Figure 2). Since the Fourier transform of the sinusoidal pattern is three impulses the Fourier transform of such an incoherent image contains three replicas of the object spectrum. The two shifted object spectra contain parts of the object spectrum which normally lie outside the passband of the imaging system. Therefore, these contain the superresolution information we desire. We can recover the three object spectra as long as we take three or more images with distinct phase shifts in the sinusoidal illumination pattern (Figure 3).
Figure 3. The three superimposed object spectra can be recovered from three or more sinusoidally patterned images
The shifted versions of the recovered object spectra are moved to their actual positions in spatial frequency space and added to the conventional unshifted object spectrum with appropriate weighting to obtain a superresolved image. The spectrum of such a reconstruction is shown in Figure 4.
Figure 4. Reconstructed image spectrum with 75% superresolution in one orientation
If a high spatial frequency sinusoidal pattern is used the reconstructed image can have as much as twice diffraction limited resolution for objects with linear absorption and emission. The above simulation uses a sinusoid of spatial frequency at 75% of cutoff spatial frequency. Therefore the reconstructed image shows 75% superresolution. It will have superresolution along the direction perpendicular to the sinusoidal pattern used. Similar reconstructions with the orientation of the sinusoid rotated by 60˚ and 120˚ can be added to the above to fill in the entire OTF (Figure 5).
Figure 5. Superresolved image spectrum with 75% superresolution in all orientations versus spectrum of conventional image taken with uniform illumination
In Figure 6 we see a comparison of (a) the pristine object, with (b) the conventional image taken with a uniform illumination, (c) the reconstructed image with 75% superresolution and (d) a comparable image taken with a uniform illumination through a 75% larger pupil. This shows that this approach really does obtain true superresolution information.
Figure 6. Comparison of pristine object, conventional image taken with a uniform illumination, reconstructed image with 75% superresolution and image taken with uniform illumination using a 75% larger pupil
Figure 6. Comparison of pristine object, conventional image taken with a uniform illumination, reconstructed image with 75% superresolution and image taken with uniform illumination using a 75% larger pupil.
Human trichromacy relies on three different cone types in the retina; long- (L), middle- (M), and short- (S) wavelength-sensitive. Dichromatic color vision results from the functional loss of one cone class, however one of the central questions has been whether individuals with this form of red-green color-blindness have lost one population of cones or whether they have normal numbers of cones filled with either of two instead of three pigments. Evidence has accumulated favoring the latter view in which the photopigment in one class of cone is replaced but the issue has not been resolved directly. Berendschot et al. (1996) measured optical reflectance spectra of the fovea for normals and dichromats and their analysis favored the replacement model. Psychophysical experiments, based on frequency of seeing curves, have also provided evidence that the packing of foveal cones in dichromats is comparable to that in trichromats. Most recently, in comparing mean contrast gains derived from the electroretinogram (ERG) for dichromats to those of trichromats, Kremers et al. (1999) concluded that complete replacement occurs in dichromacy.
Since these studies, our understanding of the molecular genetics of human color vision defects has increased dramatically. The L and M cone photopigments are encoded by genes that reside in a head-to-tail tandem array on the X-chromosome. Due to this arrangement, there is a high propensity for these genes to undergo unequal homologous recombination. This intermixing of the L and M genes has produced a wide array of genetic causes for red-green color vision defects, though mechanistically they can be placed into two main categories. In one category, the gene(s) for a spectral class of pigment are lost, not expressed, or are replaced with a functional gene for a different spectral class. Alternatively, a gene is replaced by another that encodes a non-functional photopigment. In light of this genotypic variability, it seemed plausible that there could be associated phenotypic variability within what has classically been supposed to be a single class of dichromats.
Adaptive optics (AO) enables visualization of cone photoreceptors with unprecedented resolution by correcting for the eye’s aberrations. When combined with retinal densitometry, the spectral identity of individual cones can be deduced and pseudocolor images of the trichromatic cone mosaic in the living human eye can be obtained (see “The trichromatic cone mosaic”). Using this same technique to obtain images of the dichromatic cone mosaic in two individuals for whom the genetic cause of dichromacy was known, we confirm that replacement of the photopigment in what normally would have constituted a third class of cone does occur, though surprisingly one of the dichromats showed, in addition to the loss of his M-cone pigment, a patchy loss of normal cones throughout the photoreceptor mosaic (see the figure below). This finding shows that in some eyes, color blindness can arise from the loss of an entire class of cone.
Normal subject MM and abnormal retinal subject NC Copyright © 2004, Center for Visual Science.  All rights reserved.

The harmonious and interdependent
functioning of the various systems in
the body requires the maintenance of a
very accurate environment within the
body, and a means of communication
between sometimes distant organs
and tissues. These homeostatic
functions are achieved extremely
efficiently and (in health) successfully
by two major bodily systems. In
temporal terms, the nervous system
effects this obligation in the short
term, while the endocrine system is
concerned with the longer term
execution of this essential task.
The nervous system and its abnormalities have
been covered in previous articles in this series
(Parts 1, 4a and 4b). The endocrine system
consists of various glands which secrete
hormones directly into the blood stream.
Hormones are either steroids (e.g. cortisol,
androgens) or proteins, e.g. insulin. They may
exert their effects at a site distant from the
secretory gland or may exert a more
generalised effect on different systems of the
body. Cells secreting protein hormones have a
very well developed, rough endoplasmic
reticulum (it is called rough because of the
presence of countless ribosomes on its surface;
ribosomes are the site of protein synthesis).
Preponderance of smooth (without ribosomes)
endoplasmic reticulum is typical of cells
secreting steroids. Both these types of cells
also possess well-developed mitochondria and
Golgi apparatus; the former are the power
houses of the cell and would generate the
energy required for the secretory activity. The
latter is concerned with the accumulation,
concentration and storage of secretions
(  ).
Hormone levels in the body and the
magnitude of their effects are finely controlled
by feedback mechanisms. For example, the
secretion of glucocorticoids from the adrenal
cortex is stimulated by adrenocorticotrophic
hormone (ACTH), which is released from the
pituitary gland – and as a feedback mechanism,
high levels of glucocorticoids in the blood
inhibit the release of ACTH from the pituitary.
In this way the levels of hormones in the blood
and at the target organ are finely tuned to
meet differing physiological demand.
Endocrine glands include the pituitary,
which secretes ACTH (see above), growth
hormone (GH), prolactin, follicle stimulating
hormone (FSH), and thyroid stimulating
hormone (TSH); the adrenal gland, which
secretes corticosteroids (cortex) and
catecholamines (medulla); the thyroid gland,
which secretes thyroxine (T4) and
tri-iodothyronine (T3); testes/ovaries, which
secrete androgens/oestrogens respectively; and
Islets of Langerhans of the pancreas, which
secrete insulin (B cells) and glucagon
(A cells).
When the tuning of the levels of hormone
breaks down, too much or too little hormone is
secreted, leading to a predictable syndrome.
Underactivity of an endocrine gland is treated
with the relevant hormone; overactivity by
administration of drugs which inhibit secretion
of that particular hormone, or by using an
antagonist of that hormone.
Diabetes mellitus
Diabetes mellitus is a disease of increasing
incidence which is only too familiar to
optometrists owing to its ocular complications
(see later). It is a disease which causes
considerable mortality and morbidity, including
cardiac complications, retinopathy, neuropathy
and nephropathy. The epidemiology is complex
but certain features are worthy of mention. The
disease is more common in certain races,
particularly in Indians living outside the subcontinent, e.g. in Malaysia, Singapore, Fiji and,
indeed, in the UK. It is rare in Eskimos.
Physiology of glucose metabolism 
Glucose is a monosaccharide, i.e. it is a simple
unit of sugar just like fructose and galactose.
Sucrose, maltose and lactose are disaccharides,
i.e. double units of sugars formed by the
combination, respectively, of two
monosaccharides (  ). Complex
carbohydrates or polysaccharides, such as
glycogen or starch, are long chains, sometimes
branched, of simple sugars. Glucose is an
important substrate required for the provision
of energy in many organs and tissues in the
body, e.g. the brain uses glucose as its
principal energy source.
Glucose levels in the body, and particularly
in the blood are maintained within a
very precise range in health, namely
80-100mg/100ml (≈4.5-6.5 mmoles/litre).
Certain processes affect the blood levels of
glucose. These include glycogenolysis,
gluconeogenesis, hepatic glucose synthesis,
extrusion out of cells, all of which tend to
increase blood glucose; and glycogenesis,
glucose utilisation and entry into cells which
tend to reduce blood levels. Insulin inhibits the
former and promotes the latter actions, thus its
26 August 16, 2002 OT
Figure 1
Structure of a cell from a gland secreting a protein-based
hormone, as seen under an electron microscope. Note the well
developed rough endoplasmic reticulum, Golgi complex and
mitochondria (only a few of these latter are shown here). A cell
from a gland secreting a steroid hormone would be similar
except that the smooth endoplasmic reticulum would be
abundant instead of the rough (also see text)
Understanding disease
Medicine and surgery for the optometrist
Part 6: Endocrine diseasewww.optometry.co.uk
has a hypoglycaemic effect, while glucagon has
the opposite effects (  ).
Insulin is secreted by the B cells of the
Islets of Langerhans in the pancreas (A cells
secrete glucagon). It is produced initially as a
polypeptide of 109 amino acid residues, called
preproinsulin, which is cleaved into two
peptides, one being proinsulin, consisting of 86
amino acid residues. Proinsulin is digested by
another proteolytic enzyme into insulin
(51 amino acids) and C-peptide (35 amino
acids) in the B cell granules. The insulin is then
released into the circulation. C-peptide has
some insulin-like activity and may, in fact, have
the capacity to modulate the actions of insulin,
by enhancing them at low insulin concentration
and dampening them at high insulin
concentration
1
.
Aetiology and pathogenesis
There are several factors which may play a part
in the causation of diabetes mellitus; these
interact with one another, and are different in
the two types of primary diabetes. Firstly
genetic factors are of considerable significance,
particularly in non-insulin dependant diabetes
mellitus (NIDDM). In this type, there is an
increased prevalence of the disease in the
relatives of sufferers; also the concordance
between monozygotic twins is nearly 100%,
suggesting that genetic factors play at least a
partial role in the aetiology of NIDDM. There is
some evidence that one gene defect in NIDDM
is located on chromosome 12
2
. A total of 80%
of NIDDM patients are overweight, so obesity is
another important factor. 
The basic defects of insulin physiology in
NIDDM have been shown to be both a reduced
release of insulin from B cells and a resistance
to insulin in the target organs. The latter has
been elucidated as being partly due to
reduction in the number of insulin receptors,
but also connected with a postreceptor
mechanism, possibly due to malfunction of the
transport effector proteins
3

Three main factors appear to be involved in
the aetiology of IDDM – genetic, infective
(viral) and auto-immune.
The genetic tendency, although less evident
than in NIDDM, is borne out by the greater
frequency of certain histocompatibility antigens
in affected individuals. These are principally
HLA-B8, HLA-B15, HLA-DR3 and HLA-DR4 (no
specific HLA antigens have been identified in
NIDDM).
Diabetes can also occur secondary to other
conditions. In particular, when antagonists of
insulin are excessively produced,
hyperglycaemia results. This occurs in
hyperadrenalism, Cushing’s syndrome and
acromegaly, since adrenaline,
glucocorticosteroids and growth hormone,
respectively, are insulin antagonists.
Clinical features
The lack of insulin in IDDM results in
hyperglycaemia, and if the blood glucose level
exceeds the renal threshold (180mg/100ml),
glycosuria. Loss of calories in the urine results in
weight loss in the face of polyphagia (increased
appetite). The increased osmolarity of the urine
draws in water into the renal parenchyma
leading to polyuria followed, in turn, by
polydipsia due to dehydration. Fatigue and
infection are also commonly seen (  ). 
In IDDM, these symptoms occur abruptly,
with the patient often presenting with severe
ketoacidosis (accumulation of ketone bodies
like acetoacetate and hydroxybutyrate in the
blood and tissues) which may be accompanied
by coma. The peak age of incidence is 11 to 13
years, i.e. around puberty, although it can
occur earlier and young adults may contract it,
too. IDDM is unusual after the age of 40.
In NIDDM, polyuria, polydipsia and weight
loss occur over several weeks or months, and
dizziness, fatigue and blurred vision can also
occur. Ketosis is not a feature since some
insulin, or indeed excess of it, is usually
present. NIDDM usually occurs after the age of
40, and can be precipitated by pregnancy or
concurrent chronic illness. Since it may have
been present for some time before diagnosis,
retinopathy or nephropathy may be presenting
features.
Treatment
The control of diabetes is centred upon diet,
hypoglycaemic agents and insulin. The first
encompasses a good balance of the various
nutrients in food (high protein, moderate
amounts of complex carbohydrates, and very
low saturated fats), timing of meals and snacks
in relation to glucose levels and other therapy,
and caloric control. Hypoglycaemic agents are
useful in NIDDM, although some patients with
NIDDM may also require insulin. 
Drugs used include the sulphonylureas,
namely tolbutamide (RASTINON, which has a
short half-life and needs administration b.d. or
t.d.s.), glibenclamide (EUGLUCON), tolazamide
(TOLANASE), gliclazide (DIAMICRON), and
chlorpropamide (DIABINESE, once daily); and
the biguanide, metformin (GLUCOPHAGE).
Hypoglycaemic drugs have been traditionally
said to promote the release of insulin from
B cells. The mechanism of this release appears
to be by the closure of ATP-sensitive K
+
[K(ATP)]
channels, which results in opening of Ca
2+
channels and consequent exocytosis of insulin
Figure 2
The chemistry of the simple sugars; in the
intestine the physiological process is the
digestion of disaccharides to
monosaccharides
Figure 3
The various processes which modulate
blood glucose levels; actions probably
promoted by insulin are shown in red
Figure 4
Flow chart illustrating the pathophysiology of diabetes mellitus and the mechanism of
production of some of the clinical features